
Monitor AI Workflows: Five Metrics Before Silent Errors Reach Customers
A workflow can finish successfully at the technical level and still be wrong for the business: an enquiry reaches the wrong team, a record is created twice, or AI produces a plausible but inaccurate response. The green tick in an automation tool only proves that the run ended. It does not prove that the business outcome is correct.
Good operations therefore answer five simple questions: Did every case arrive? Is the result correct? How many cases need a person? How long does the whole process really take? And how often must outcomes be corrected? Together, these answers create a small control system that fits an SME without turning into a large observability project.
In brief
- Success is a business outcome: “workflow completed” is not sufficient proof of quality.
- Five values are enough to start: intake coverage, business accuracy, exception rate, P95 cycle time and correction rate.
- Samples reveal silent errors: technically successful runs also need regular business review.
- Traffic lights need local thresholds: risk, volume and the process goal determine when to warn or stop.
- A manual way back is part of automation: stop, preserve, continue manually and restart under control.
Why monitoring now belongs in the process
AI is moving from isolated chats into operational workflows. According to Eurostat, 20.0% of EU enterprises with at least ten employees used AI technologies in 2025, up 6.5 percentage points from 2024. Written-language analysis was the most common use. That is exactly where many practical email, document and customer-enquiry workflows begin.
The 2026 OECD D4SME survey also finds that strategic, targeted and secure integration into business operations remains uneven, while time constraints, maintenance costs and skills gaps hold implementation back. Its sample covers more than 2,000 SMEs in twelve OECD countries and is explicitly non-representative: useful as a directional picture, not as an exact rate for every market.
NIST AI 800-4 likewise separates functionality, operational and human-factors monitoring after deployment, among other categories. The practical point for SMEs is simple: pre-launch tests still matter, but real inputs, changing data and non-deterministic outputs make ongoing checks necessary.
The five metrics for a dependable AI workflow
1. Intake coverage: Was every case processed?
Formula: uniquely processed cases ÷ uniquely received cases × 100. Give every incoming case a stable ID. This exposes lost webhooks, skipped attachments and duplicate transfers.
2. Business accuracy: Is the outcome correct?
Formula: samples that pass business review ÷ samples reviewed × 100. Do not inspect failures only. Randomly select technically successful cases and compare them with a clear expected answer or rubric. This follows the same basic idea as the evaluation probes described by NIST in 2026: outputs are checked against trusted references and retained as a traceable record.
3. Exception rate: How much reaches a person?
Formula: escalated or unresolved cases ÷ all cases × 100. A high rate may signal weak input data or rules that are too narrow. An unusually low rate can also be dangerous if the system has stopped recognising uncertainty. The goal is a plausible range, not blindly minimising human work.
4. P95 cycle time: How long do the slowest typical cases wait?
An average hides queues. P95 means that 95% of cases finish within this value. Measure from the business intake to the usable outcome, not just the runtime of one node.
5. Correction and replay rate: What must be undone or run again?
Formula: corrected, duplicated or replayed cases ÷ all cases × 100. This metric connects quality with cost: every correction consumes time and may confuse customers. For replays in workflows that write to other systems, idempotent safeguards prevent duplicate actions.
A fictional traffic-light model for enquiry routing
The following matrix is neither an industry standard nor a customer case. It only shows how an SME could document limits before launch. Stricter thresholds alone are not sufficient for pricing, contracts, payments or other consequential decisions; they require a separate legal and risk assessment plus human approval.
| Metric | Green | Amber | Red / action |
|---|---|---|---|
| Intake coverage | ≥ 99% | 97–<99% | <97%: reconcile intake, stop inflow |
| Sample accuracy | ≥ 95% | 90–<95% | <90%: pause automatic output |
| Exception rate | 10–20% | 5 to <10% or >20 to 25% | <5% or >25%: investigate cause |
| P95 cycle time | ≤ 15 min | >15–30 min | >30 min: inspect backlog and dependencies |
| Correction rate | <2% | 2–5% | >5%: pause write access |
Set up monitoring in seven steps
- Define the business outcome: write one sentence that says when a case is truly complete.
- Name an owner: one person owns the metrics, limits and decision to restart.
- Carry the case ID through: intake, AI step, system change, exception and completion must remain connected.
- Collect expected cases: start with typical cases, edge cases and known failures. Minimise or anonymise sensitive data.
- Set traffic lights and an alert channel: not every amber state needs an alarm, but red must reach someone who is available.
- Test the stop and fallback path: be able to disable writing, buffer intake and continue the process manually.
- Learn briefly every week: spend 15 minutes on samples, exceptions, corrections and exactly one improvement.
Tools already provide useful building blocks. The n8n execution documentation, for example, describes status filters, saved execution data and controlled retries. The business layer still matters most: a technical trace must connect to the actual outcome. The same principle applies to Make, Zapier and custom API integrations.
The incident plan for silent errors
- Stop: pause risky writing or sending actions without deleting intake data.
- Preserve: retain affected case IDs, versions, inputs and outputs unchanged.
- Take over manually: route new cases to the documented fallback queue.
- Scope: determine the time window and affected cases; prioritise customer impact.
- Fix and test: run the change against expected cases and the exact failure first.
- Replay under control: repeat idempotent steps only and prevent duplicate messages.
- Restart: begin with low volume, tight sampling and documented approval.
Transparent example calculation: controls take time – and protect the value
Fictional scenario, not a customer case: a company routes 300 enquiries per month. Manual routing takes four minutes on average: 300 × 4 minutes = 1,200 minutes, or 20 hours.
- 45 exceptions (15%) × 4 minutes of human handling = 3 hours
- 30 random quality checks × 2 minutes = 1 hour
- Monthly review, maintenance and one fallback-path test = 2 hours
- Total controlled operations = 6 hours
- Calculated capacity difference = 20 − 6 = 14 hours per month
At a purely illustrative internal fully loaded rate of €45 per hour, that would equal €630 of monthly capacity. Setup, software, business changes and potential error costs are not included. Replace volume, minutes, exception rate and control effort with your own measurements before investing.
Sources and photo credit
Information and links checked on August 11, 2026.
- NIST: Challenges to the Monitoring of Deployed AI Systems – categories and open questions for post-deployment monitoring.
- NIST: Building Evaluation Probes into Agentic AI – automated verifiers and machine-readable audit trails.
- OECD: Empowering SMEs in the age of AI – the 2026 D4SME survey on adoption and integration barriers.
- Eurostat: 20% of EU enterprises use AI technologies – EU enterprise data for 2025.
- n8n Docs: All executions – status, filters and controlled execution retries.
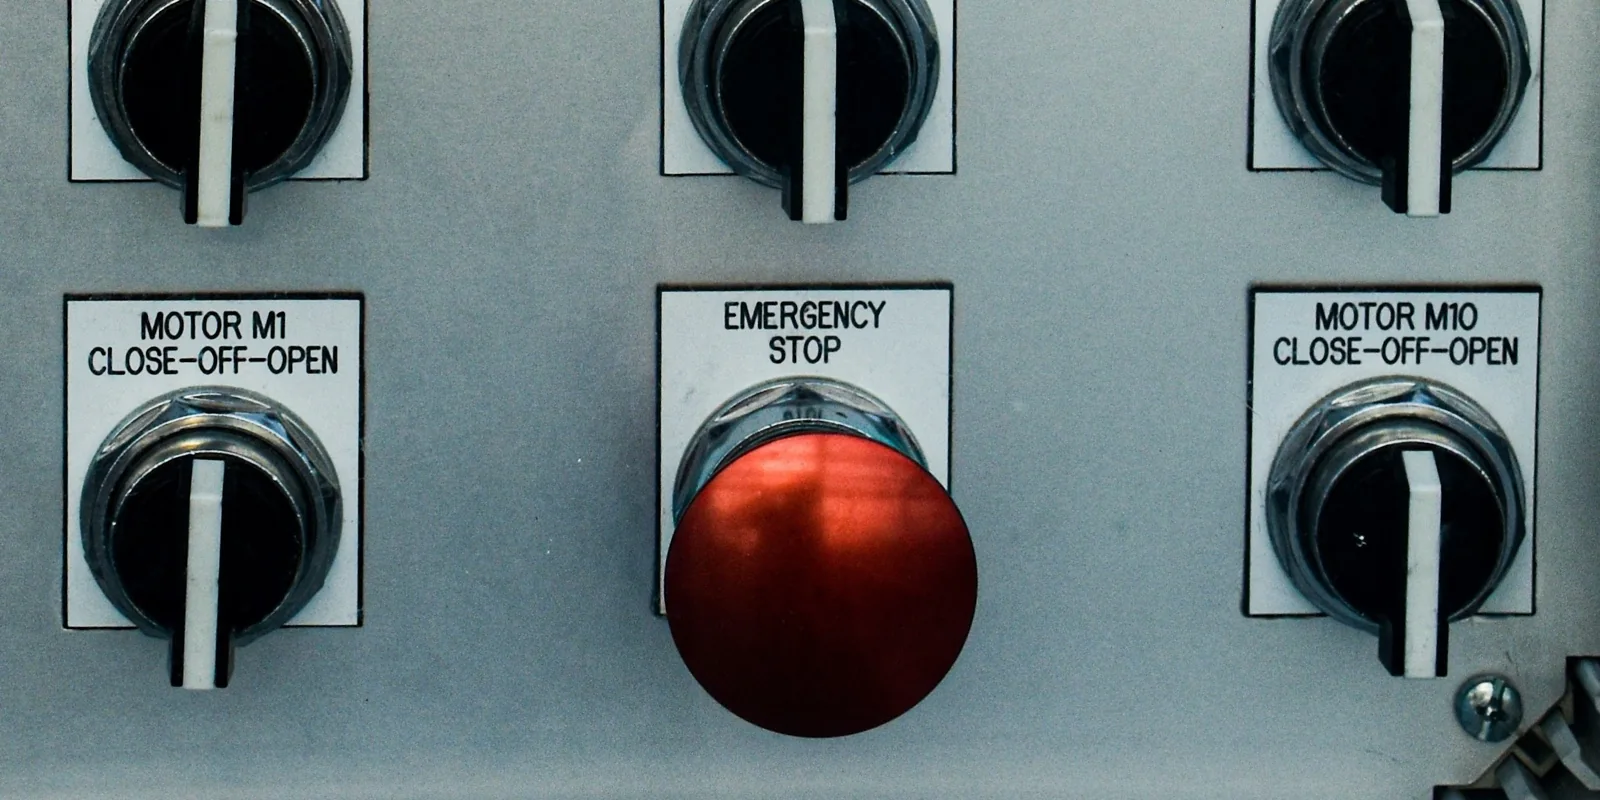
- Photo: Sebastian Schuster on Unsplash, under the Unsplash License, which permits commercial use and modification. The source page identifies a Nikon D3400 and a real motor control panel.
Does your workflow run – or can you prove it delivers the right result?
Lyron combines the process goal, business sampling, error channel and manual fallback into maintainable operations. We start with one concrete workflow and representative, appropriately protected and minimised case data.
Book a free workflow check